
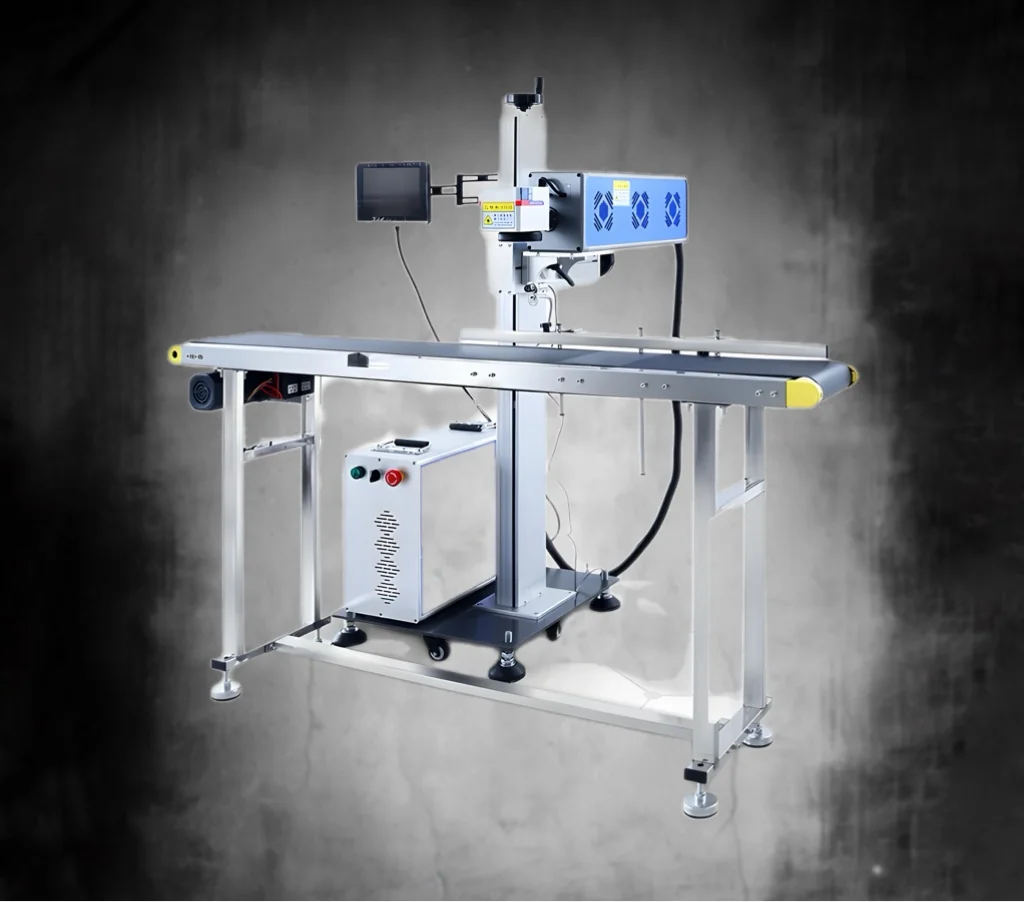
Useful output from connected equipment

Packaging Line Balancing and OEE

Plan around effective rates and production losses so the complete automatic line—not one headline machine—delivers more accepted packs.

High-volume automatic packaging line for line balancing and OEE

Line balancing aligns the effective capacity and response of connected modules. OEE—availability × performance × quality—is one framework for separating time loss, speed loss and rejected output, but the underlying stop and production data is what guides action.

1. Separate rated speed from effective capacity

Rated speed may describe a machine under a defined ideal condition. Effective capacity considers the actual product and pack, cycle pattern, replenishment, minor stops, quality checks and the margin needed to recover after an interruption.

For indexed machines, the number of packs per cycle and cycle time matter. For continuous machines, component feeding and stable product presentation may be the limiting factors. Record assumptions beside every proposed rate.

Rate definitions used in line planning
RateMeaningUse
Rated speedPublished or configured maximum under stated conditionsInitial machine comparison
Effective machine rateExpected output for the actual format and normal interventionsLine capacity model
Sustained line rateGood packs maintained over an agreed production periodBusiness and acceptance target
Shift outputGood packs after planned and unplanned lossesProduction planning

2. Map the complete flow and constraint

Draw each operation from component supply to finished-unit removal. Add cycle rates, buffer capacities, manual tasks and expected stops. The lowest effective rate may be the obvious constraint, but a feeder or case-packing task can limit the line even when its machine rating appears sufficient.

Repeat the exercise for different formats. A filler may constrain a large dose, while capping or labelling may constrain a smaller decorative pack.

  • Product supply and batch change
  • Container and cap feeding
  • Filling cycle by dose
  • Closure and label format
  • Inspection and reject handling
  • Collation and case packing
  • Operator replenishment and removal

3. Use buffers for defined disturbances

Accumulation allows upstream and downstream modules to continue for a limited time when an adjacent machine stops. It is useful for frequent short disturbances, but it consumes space and can create back pressure, scuffing or product-age issues.

Calculate buffer need from the disturbance duration, pack rate and acceptable pressure. Decide whether the buffer should protect the constraint, allow replenishment or separate a batch process from continuous equipment.

4. Coordinate machine response and controls

A balanced mechanical layout can still perform poorly if machines stop and restart independently without a clear line philosophy. Define blocked and starved states, sensor positions, restart conditions, low-level warnings and the response to quality rejects.

Avoid excessive stop propagation. A downstream machine may be able to complete the pack it contains safely before stopping, while an upstream filler may need to finish a dose or protect open containers. These details are application-specific.

  • Starved and blocked status
  • Run permissives and controlled stop
  • Buffer high and low levels
  • Feeder low-level warning
  • Fault and reset ownership
  • Reject full or inspection fault response

5. Understand the OEE categories

OEE multiplies availability, performance and quality. Availability compares run time with planned production time. Performance compares actual speed with the defined ideal rate while running. Quality compares accepted output with total output.

The result is useful only when the underlying definitions are consistent. An inflated ideal rate can make performance look poor, while excluding changeovers from planned time can hide an important operational loss.

  • Define planned production time
  • Use a credible ideal rate by format
  • Count rework and rejects consistently
  • Keep loss categories stable over time
  • Review the component measures, not only the multiplied percentage
OEE=Availability×Performance×Quality

6. Capture a small set of reliable stop reasons

Start with categories operators can identify consistently: no bottles, no caps, product supply, filler fault, capper fault, labeller fault, downstream blocked, quality hold, changeover and cleaning. Add detail only when it will lead to action.

Automatic stop capture may identify the first device to signal, not the root cause. Combine controls data with operator context and observation of the line.

Example loss hierarchy
LevelExampleDecision supported
AreaUpstream, filling, closing, downstreamWhere to investigate
CauseNo caps, label break, product lowWhat condition stopped flow
DetailCap elevator empty, roll endSpecific corrective action
Duration/frequencyLong rare or short frequentPriority and solution type

7. Treat changeovers as part of capacity

A flexible line can lose more output through format and product changes than through running speed. Observe the full sequence from the last good pack of one format to the first approved pack of the next.

Separate internal work that requires the line stopped from external preparation that can happen while the line runs. Organised tools, labelled parts, recorded settings and pre-staged materials can improve repeatability without changing core machinery.

  • Last-to-first-good measurement
  • Cleaning and product clearance
  • Tool and change-part collection
  • Mechanical adjustment and recipes
  • Quality approval and first-off samples
  • Return and storage of previous format parts

8. Improve the constraint, then rebalance

When the current constraint improves, another stage will become limiting. This is expected. Recalculate the line and observe the new stop pattern rather than assuming the same improvement will continue indefinitely.

Possible actions include maintenance, improved component quality, feeder capacity, conveyor changes, control tuning, change-part redesign, added nozzles, replacement machinery or a different production schedule. Select the least complex action that addresses the measured loss.

  1. Measure the current baseline
  2. Identify the active constraint by format
  3. Confirm the dominant loss mechanism
  4. Implement one controlled change
  5. Verify good output and unintended effects
  6. Rebalance and repeat

9. Use acceptance tests that reflect line behaviour

A very short run may demonstrate individual cycles but not component replenishment, buffer behaviour, normal minor stops or end-of-line flow. Select an acceptance period and material quantity that represent the agreed duty while remaining practical.

Record interventions, rejects, stops and the line state at the beginning and end of the run. Agree how planned pauses, sample checks and customer-supplied material defects are treated.

Key takeaways

  • Use effective machine rates and sustained good output in the line model.
  • Identify the constraint for each priority product and format.
  • Add accumulation for specific short disturbances, not as a substitute for capacity.
  • Define line stop, restart, starvation and blockage behaviour in the controls scope.
  • Use OEE components and reliable loss data to direct improvements.

Start with your product and production goal

Turn the guide into a project brief

Bring the product, pack format, output target and site information together. Lancing Ltd can then help narrow the appropriate automatic-line route.

Straight answers

Frequently asked questions

What is the bottleneck in a packaging line?

It is the resource or condition that limits useful line output for a given product and format. It can move between machines, feeding, cleaning, labour or downstream packing.

Should every machine run at the same speed?

No. Effective capacity, cycle pattern, recovery margin and buffer strategy should be coordinated. Identical headline speeds can still create a poorly balanced line.

Does accumulation increase machine speed?

No. Accumulation can isolate short interruptions and let adjacent machines keep running temporarily, but it does not remove a sustained capacity constraint.

What data should be collected first?

Start with good count, reject count, planned time, running time, stop duration, stop category, format and changeover duration. Use a manageable set of reliable categories.

Next steps

Loss-tree governance

Collect a small set of reliable states before calculating more metrics

OEE is useful only when the time basis, ideal rate, good-count point and reject definition are consistent. For line improvement, a reliable loss tree with clear starved, blocked, fault, planned stop and changeover states is often more actionable than a large dashboard with uncertain data.

Measure at the end of the defined line boundary and retain enough machine-level information to identify the constraint. When the constraint moves after an improvement, the line balance and buffer strategy should be reviewed again.

Packaging-line loss data structure
Data itemDefinition to agreeDecision supported
Planned production timeIncluded shifts, breaks, cleaning and planned maintenanceAvailability denominator and capacity comparison
Good countAccepted pack at the agreed line endpointBusiness output and quality calculation
Ideal or reference rateApproved rate for the active format under stated conditionsPerformance calculation and comparison
Stop state and reasonMutually understood event, source and duration ruleConstraint analysis and improvement priority

Information to prepare

  • Defined line boundary
  • Good and reject count points
  • Reference rate by format
  • Planned-time convention
  • Stop-state hierarchy
  • Regular data-quality review

Continue the project

Use the related pages to turn this guidance into a clearer scope and a more useful technical discussion.

Actionable line-loss evidence

Use a stop-cause hierarchy that exposes the line constraint

When several connected machines stop together, the data system can create many alarms for one production event. A stop-cause hierarchy should identify the initiating condition, preserve useful local detail and avoid counting the same lost time against several modules.

The hierarchy must match the defined line boundary and count point. Validate automated states against witnessed production before using them to compare shifts, justify a buffer, change staffing, replace equipment or calculate OEE.

Packaging-line stop-cause hierarchy
State or loss familyClassification rule to agreeDecision supported
Planned stopState which breaks, cleaning, maintenance, meetings, product preparation and scheduled non-production periods are inside or outside planned production timeConsistent availability basis and realistic capacity planning
StarvedRecord that the module or line cannot run because acceptable upstream product or components are unavailableProduct supply, feeder, replenishment and upstream-capacity improvement
BlockedRecord that downstream capacity or acceptance is unavailable and identify the first downstream condition causing the blockAccumulation, end-of-line capacity and recovery-policy decisions
Local machine faultUse the initiating machine fault or protective condition, while retaining secondary alarms for diagnosis rather than additional lost timeReliability, maintenance and controls improvement
Material or component lossSeparate missing supply from poor-quality product, containers, closures, labels, film, cases or coding materialsSupplier quality, storage, handling and material-specification action
Quality and reject lossDefine good and reject count points, reason ownership, rework treatment and whether the line continues, pauses or stopsProcess capability, inspection and waste reduction
Changeover or cleaningUse clear start and finish events, identify internal and external work and keep planned standard separate from observed timeFormat strategy, preparation and operator-method improvement
Short stop or micro-stopSet a consistent duration rule and preserve repeated events that consume capacity even when each event appears smallSensor, transfer, pack-stability and minor-adjustment priorities

Minimum dataset for an improvement review

  • Defined planned production time
  • Active product, pack format and approved reference rate
  • Accepted and rejected counts at named points
  • First-cause state, source, start and end time
  • Starved, blocked and local-fault distinction
  • Changeover, cleaning and planned-stop convention
  • Data-quality check and unresolved classifications

Connect loss evidence to engineering action

Use the hierarchy to determine whether the next action belongs in accumulation, component feeding, controls, maintenance, changeover, end-of-line capacity or a wider retrofit scope.

First-cause loss data

Avoid counting one line stop as losses on every machine

When a downstream fault blocks the line, several upstream modules may stop. A useful OEE or line-loss model records the initiating event, propagation and recovery rather than assigning the full duration independently to every affected machine.

Line event record
FieldPurpose
First causeIdentifies the event that changed the line from productive operation
Affected zoneShows how the event propagated through starved and blocked conditions
Product and formatExposes application-specific patterns
Operator interventionSeparates automatic recovery from manual work
Good and reject countsConnects availability to accepted output
Verified corrective actionConfirms whether the evidence changed after improvement

Use the controls architecture guide to define states and count points, and the troubleshooting guide to investigate repeated starved, blocked and reject events.

Measurement quality

Make count points and stop definitions comparable before acting on OEE

OEE and line-loss reports are useful only when the underlying counts, states and time rules describe the same production boundary.

Choose the line’s accepted-output count point and document how later rejects, rework and manual removals are treated. If individual machines count containers at different points, their totals will not reconcile automatically. The same issue applies to speed: a nominal machine rate, an instantaneous line rate and sustained good output are different measures.

Stop reporting also needs one agreed first-cause rule. When a downstream machine blocks, several upstream machines may report “blocked” and then stop. Counting every response as an independent loss exaggerates the event and hides its origin. Capture the initiating condition, the affected line state and the time needed to return to stable accepted output.

Review the definitions whenever controls logic, inspection position, reject handling or the line boundary changes. A stable dashboard with inconsistent definitions can be more misleading than a simple verified production record.

OEE data checks before comparison
MeasureDefinition to agree
Planned production timeIncluded shifts, breaks, changeovers, cleaning and planned engineering windows
Good countFinal accepted count point and treatment of later rejects or rework
Ideal cycleFormat-specific basis and whether it reflects a machine or the whole line
First-cause stopRule for assigning one initiating event across dependent machines
Recovery timeWhether the event ends at reset, restart or stable accepted output

Use the data integration and production-reporting guide to define the interface, ownership and acceptance evidence behind these measures.